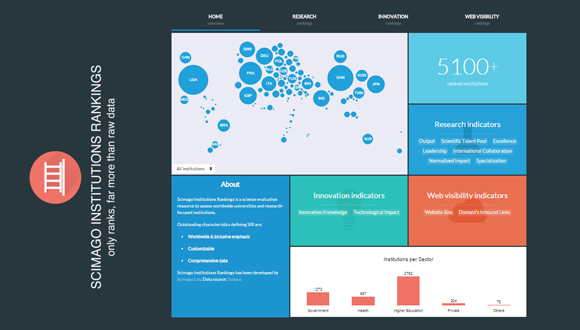
CREAF enters into SCImago Institutions Rankings

Of the 243 ranked Spanish entities, four indicators place CREAF within the first 30 ranked positions. For those indicators which are not dependent on the size of the institution, CREAF is among the 50 best national institutions.

For the first time in it’s twenty-five years of history, CREAF has been included in the annual ranking carried out by SCImago Institutions Rankings (SIR) of the SCImago Research Group. The SIR report is the most complete classification of its kind for the analysis of institutions’ research results.
Each year SCImago Research Group publishes a report based on different bibliometric indicators evaluating the performance of different research institutions worldwide, including their scientific output and level of excellence, among other factors. To be able to enter into the ranking it is necessary to have published at least 100 publications in journals indexed in the SCOPUS bibliographic repository in the final year of the 5-year period evaluated (this 2014, 2008-2012 was considered).
The 2014 SIR indexed a total of 4851 entities worldwide and 243 at the national level, including universities, biomedical centers, and research centers.
Of the 243 Spanish entities, the 2014 SIR places CREAF in the following position:
-
- nº 210 in Spain for Output
- nº 236 in Spain for Scientific Talent Pool
- nº 28 in Spain for Excellence (nº 329 world) –> 46,18%
- nº 105 in Spain for Leadership sector
- nº 24 in Spain for Excellence & Leadership (nº 235 world) –> 38,93%
- nº 51 in Spain for International Collaboration
- nº 27 in Spain for Normalized Impact (nº 505 world) –> 9,95%
- nº 35 in Spain for Specialization
- nº 30 in Spain for Q1 (nº 184 world) –> 83,40%
Output: Total number of documents published in scholarly journals indexed in Scopus (Romo-Fernández, et al., 2011). This is a size-dependent indicator.
International Collaboration: Institution's output ratio produced in collaboration with foreign institutions. The values are computed by analyzing an institution's output whose affiliations include more than one country address (Guerrero-Bote, Olmeda-Gómez and Moya- Anegón, 2013; Lancho-Barrantes, Guerrero-Bote and Moya-Anegón, 2013; Lancho-Barrantes, et al., 2013; Chinchilla-Rodríguez, et al., 2012). This is a size-independent indicator.
Normalized Impact: Normalized Impact of led output is computed using the methodology established by the Karolinska Intitutet in Sweden where it is named "Item oriented field normalized citation score average". The normalization of the citation values is done on an individual article level. The values (in decimal numbers) show the relationship between an institution's average scientific impact and the world average set to a score of 1, --i.e. a NI score of 0.8 means the institution is cited 20% below world average and 1.3 means the institution is cited 30% above average (Rehn and Kronman, 2008; González-Pereira, Guerrero-Bote and Moya- Anegón, 2011).This is a size-independent indicator.
High Quality Publications: Ratio of publications that an institution publishes in the most influential scholarly journals of the world, those ranked in the first quartile (25%) in their categories as ordered by SCImago Journal Rank (SJRII) indicator (Miguel, Chinchilla-Rodríguez and Moya-Anegón, 2011). This is a size-independent indicator.
Specialization Index: The Specialization Index indicates the extent of thematic concentration /dispersion of an institution’s scientific output. Values range between 0 and 1, indicating generalist vs. specialized institutions respectively. This indicator is computed according to the Gini Index used in Economy (Moed, et. al., 2011; López-Illescas, Moya-Anegón and Moed, 2011; Arencibia-Jorge et al., 2012). In this indicator, when the value is 0 it means that the data are not sufficient to calculate. However, it should be noted that although the resulting specialization values range between 0 and 1, these values have been normalized on a scale of 0 to 100, as the rest of indicators. This indicator is size-independent.
Excellence Rate: Excellence rate indicates the amount (in %) of an institution’s scientific output that is included into the set of the 10% of the most cited papers in their respective scientific fields. It is a measure of high quality output of research institutions (SCImago Lab, 2011; Bornmann, Moya-Anegón and Leydesdorff, 2012; Guerrero-Bote and Moya-Anegón, 2012). This is a size-independent indicator.
Scientific Leadership: Leadership indicates the percentage of an institution’s output as main contributor, that is, the amount of papers in which the corresponding author belongs to the institution (Moya-Anegón, 2012; Moya-Anegón et. al, 2013; Moya-Anegón, et al.,). This is a size-independent indicator.
Excellence with Leadership: Excellence with Leadership indicates the amount of documents in the Excellence rate in which the institution is the main contributor (Moya-Anegón, et al., 2013). This is a size-independent indicator.
Scientific talent pool: Total number of authors from an institution in the total publication output of that institution during a particular period of time. This indicator is size-dependent.
Notícies relacionades

Una recerca descobreix que les arrels dels arbres caducifolis no dormen a l'hivern

L’IPBES publica dos informes per transformar la manera com ens relacionem amb la natura, conservar-la i sobreviure


