Current challenges for a global contribution of the European Earth Observation
European products derived from satellite and in-situ data describe the status and the temporal evolution of the planet and, combined with others, will help to understand how human activities are contributing to global change. A better organized European contribution will have even bigger influence in informed decision making.

Since the beginning of its operations, the Group of Earth Observations (GEO) organizes an annual Plenary meeting where all member states and participant organizations meet, are informed of the progress towards GEO objectives, and future actions are agreed.
EuroGEOSS will organize the European contributions to the Global Earth Observation System of Systems (GEOSS) and completes the map of regional activities with the already existing AmeriGEOSS, AfriGEOSS, and Asia-pacific GEOSS.
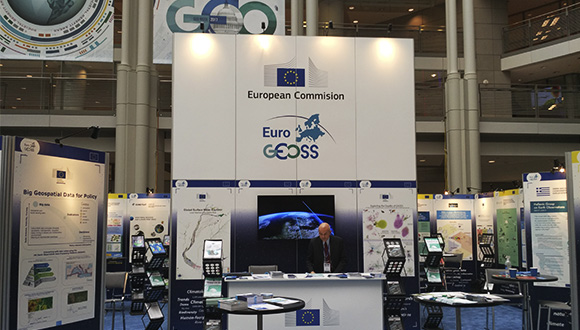
This year 2017, Washington DC hosted the plenary meeting from October 23rd to 27th, representing an opportunity to organize side events to review the status of the 2017-2020 work program activities on Earth observation. Some aspects of a novel regional activity in the work program, called EuroGEOSS, were discussed on the 23rd. EuroGEOSS will organize the European contributions to the Global Earth Observation System of Systems (GEOSS) and completes the map of regional activities with the already existing AmeriGEOSS, AfriGEOSS, and Asia-pacific GEOSS. The EuroGEOSS presentation consisted in four side events. The first one was organized by CREAF. It started at 8:00 am gathering around 70 people and addressed the role of Research and Innovation in the EuroGEOSS regional initiative. It was structured in 3 blocks, each one starting by the projection of a short video of about 10 minutes and followed by a 15 minutes discussion.
European regional level: bringing global products into the global picture
The topic of the first block tackled the combined use of regional cross-disciplinary datasets to showcase the power of GEOSS in Europe. The projected video was:
The video shows a TED session where the Earth observation scientist, Alan Belward, who investigates at the Joint Research Center in Ispra (Italy), explains that water is a natural resource and its distribution changes as a consequence of human activity such as the construction of dams, but also due to climate change effects. The European Commission, thanks to the Copernicus Programme and in collaboration with Google, has mapped surface water globally. The created open source database, with temporal coverage starting in 1984, has the aim of providing the necessary tools for making policy choices based on facts.
After seeing the video and during the discussion, other regional datasets were mentioned like the Global Forest Map, the Global Human Settlements, the Global Streamflow Characteristics, the Global Land Cover, and the European Soil database. Nowadays it is possible to analyze changes in these and other variables although we have to consider that some products are quite accurate while other applications provide products with a higher uncertainty (e.g. forest) due to a complicated spectrum separability and other technical limitations. This is why we also need validation coordinated at the regional level, Europe in this case, that will bring confidence to the data and will improve it.
The huge volume of satellite data to be processed and the synergies between remote and in situ products; factors that need to be resolved
The European Union is contributing with the Sentinel fleet of Earth observation satellites that complement the legacy of existing satellites (e.g. Landsat) which cover the globe producing an impact beyond Europe. However, this huge amount of produced data is also creating questions on how to build a distributed computing infrastructure capable of processing the big datasets and how science is going to interpret the results and extract conclusions that are usable for policy making. Although Google Earth was the engine used in the Global Surface Water mapping, the European Commission is committed to the creation of the European Open Science Cloud (EOSC) and ESA is providing the Copernicus Data and Information Access Services (DIAS).
Even if the necessary technology is already available, the lack of continuous coverage (both spatial and temporal) and the costs associated to data acquisition are still limiting factors for its use for civil applications.
Also, we have to consider that remote sensing needs to be complemented by in-situ expert data, what is particularly true for biodiversity and ecosystem products. Going from Landsat and Sentinel resolutions (10-100 m) to very high resolution satellite products (1-5m) presents complications. Even if the necessary technology is already available, the lack of continuous coverage (both spatial and temporal) and the costs associated to data acquisition are still limiting factors for its use for civil applications. We have to consider that change detection maps rely on homogeneous time series as well as on a set of pre-agreed variables and controlled semantics and in many occasions consensus on adopted legends is not reached until enough experimentation has been produced.
Transforming data in useful information and knowledge
In the second block the projected video fragment was extracted from the BBC documentary:
In this fragment, Hans Rosling illustrates how to present 100 000 data records about life expectancy and average income from the last 200 years in 200 countries in a single animated graph. He is able to project an optimistic view that shows that all countries have abandoned the low-income/low-expectancy quadrant of the graph (some sooner and others later) demonstrating that the majority of people are healthier and wealthier than 200 years ago. At the same time he correlates some sporadic behaviors of the animation with social and historical events. After the video, we discussed about how we can transform data into useful summarized information using the Sustainable Development Goals Dashboard of the World Bank as one of the possible example to follow.
We have to understand the needs of each community and designing the application that fits users’ needs.
In the past, the GEOSS Common Infrastructure (GCI) has focused on cataloging data; now we need to go beyond that and to process datasets to offer information and knowledge. This capability has been previously demonstrated on several data exploitations pilots in previous and current European Commission funded projects such as ECOPotential and NextGEOSS. In them, we learned that there is no magic solution that will cover all use cases but we have to start by understanding the needs of each community and designing the application that fits users’ needs. The technical challenge is to use the new GCI application programming interfaces and tools to extract data that can be better presented and interpreted. But, by doing so, we can also present different views that could potentially be contradictory: Actually, the video presents a vision of increasing wealth while we know that wealth has the tendency to be concentrated a reduced number of people. Perhaps EuroGEOSS needs to complement observation data with socioeconomic data and opinions to connect economic impacts in society to environmental decisions. Decision makers need to validate their policy impacts and Earth observation can produce the necessary indicators (e.g. for some of the Sustainable Development Goals; see EO4SDG initiative) but they also need to anticipate those impacts by means of future projections. In that sense, we need an EuroGEOSS modeling component interlinked with Earth observation data.
It is also important to emphasize on the continuous impacts that society is creating in the environment. Showing the temporal evolutions can be very compelling in some cases but, in order to have a wider impact, we should provide training on how to use and interpret Earth observation data. An example of this is the need to support National Statistical Offices in introducing more Earth observation on their data gathering process to complement traditional surveys making possible a global analysis but also a localized detection of particularities.
More organized and accessible data
The third block was devoted to the GEOSS Data Management Principles (DMP) research and implementation. To introduce the topic we used a horror story (actually a cartoon) by Karen Hanson, Alisa Surkis and Karen Yacobucci (NYU Health Sciences Library):
In it we can see a scientist trying to get the data behind a scientific paper from the original author. The story represents all you should not do in data management. During the discussion we recognized that in recent years, substantial work has been done on defining data management principles based on international recognized standards for Earth observation and implanting them in numerous data services that are nowadays part of the GEOSS. EuroGEOSS should focus on educating data managers on the benefits of data sharing and providing the necessary support for sustaining the data centers. Additionally, scientists need to receive recognition for managing data properly.
In some Mediterranean countries and in other parts of the world, efforts on preventing data losses, a better data sharing attitude and more support for data infrastructures are still needed.
Proper mechanisms for publishing scientific papers need to go in parallel with the ones for publishing data, such as the Digital Object Identifier (DOI) for data and proper data citation. The scientific publication industry is adapting by offering also journals for describing and exposing data, and Science journal is just one example. Reviewing and verifying data is still challenging. That is because remote sensing data quality need validation by in-situ observations and this might not be easily available to the reviewers that can only rely on expert opinions. Even if the situation is better in the more industrialized countries, in some Mediterranean countries (e.g. in the GEO-Cradle project geographical scope) and in other parts of the world, efforts on preventing data losses, a better data sharing attitude and more support for data infrastructures are still needed.
The day concluded with an European Commission event where the concept of the EuroGEOSS initiative was exposed. Europe has been contributing to GEOSS since the beginning, and it is the variety in origins and topics of these contributions that convinced the High Level Working Group and the European Caucus that a formal coordination initiative is required to articulate the European contribution in a more efficient and visible way. After some months of design, Washington DC was the scenario of the official launching of EuroGEOSS.


